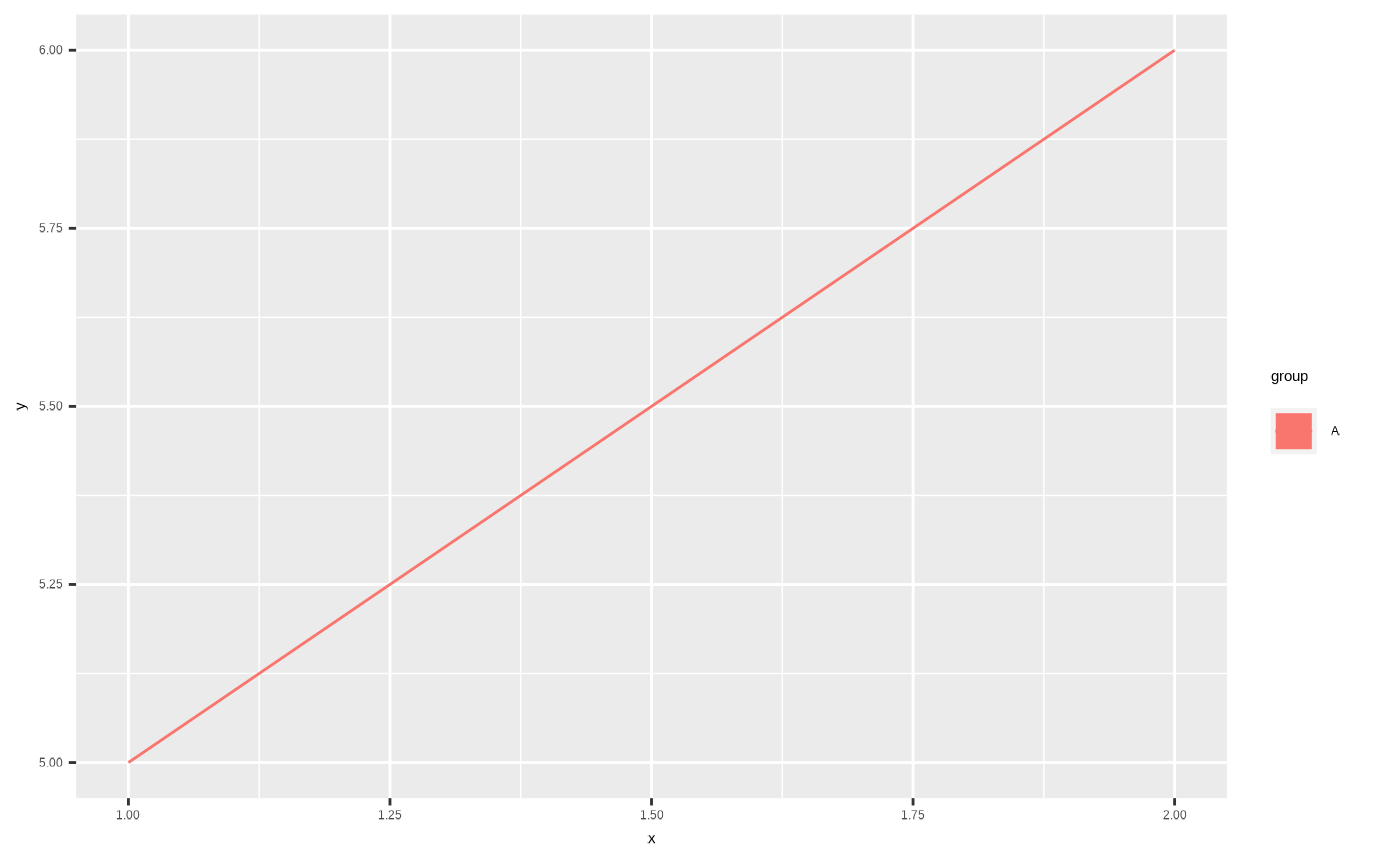
Legend symbols for line graphs default to coloured lines, which can sometimes be hard to read. This function overrides the default and converts the colours to squares. This needs to be used in conjunction with some invisible point geoms so the function has a shape to reshape.
Examples
ggplot(
  data.frame(x = c(1, 2), y = c(5, 6), group = c("A", "A")),
  aes(x, y, colour = group)
  ) +
  geom_line() +
  geom_point(alpha = 0) + # The required "invisible points"
  square_legend_symbols()
