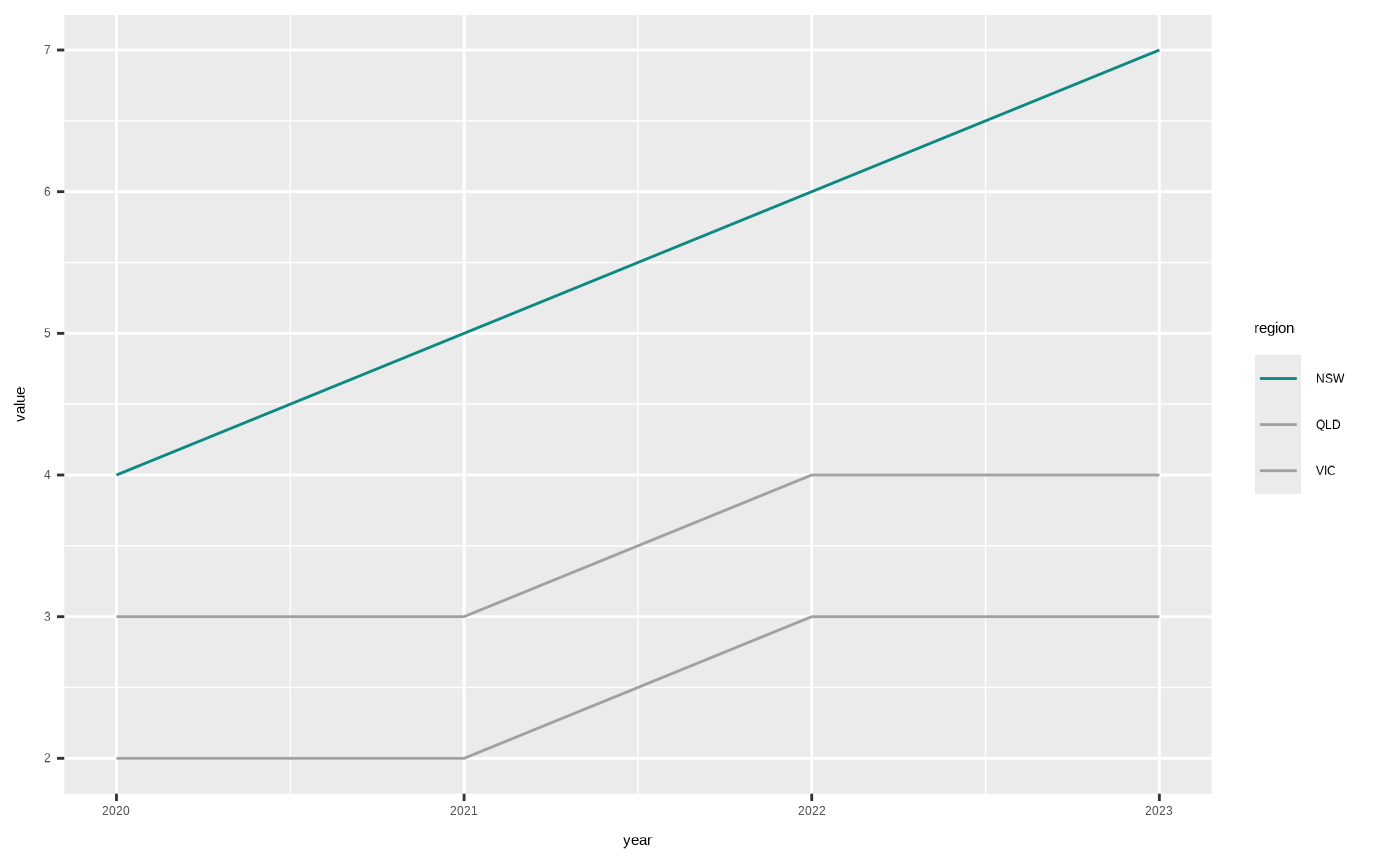
Highlight one or more groups in a colour or fill scale
Source:R/scale_e61_highlight.R
scale_e61_highlight.RdColours the specified group(s) using the e61 palette and
greys out every other level of the mapped colour/fill variable. This
is useful for drawing attention to one series (or a handful of series)
in a chart without needing a legend, in keeping with the e61 house style
of labelling directly on the graph (see plot_label()).
Usage
scale_colour_e61_highlight(highlight, unhighlighted = e61_greylight3, ...)

scale_fill_e61_highlight(highlight, unhighlighted = e61_greylight3, ...)
Arguments
- highlight
Character (or coercible) vector. The value(s) of the mapped
colour/fillvariable to highlight in colour. Every other level present in the data is greyed out.- unhighlighted
Character. Hex code or e61 colour to use for the non-highlighted levels. Defaults to
e61_greylight3.- ...
Arguments passed on to
ggplot2::scale_colour_manualvaluesa set of aesthetic values to map data values to. The values will be matched in order (usually alphabetical) with the limits of the scale, or with
breaksif provided. If this is a named vector, then the values will be matched based on the names instead. Data values that don't match will be givenna.value.aestheticsCharacter string or vector of character strings listing the name(s) of the aesthetic(s) that this scale works with. This can be useful, for example, to apply colour settings to the
colourandfillaesthetics at the same time, viaaesthetics = c("colour", "fill").breaksOne of:
NULLfor no breakswaiver()for the default breaks (the scale limits)A character vector of breaks
A function that takes the limits as input and returns breaks as output
na.valueThe aesthetic value to use for missing (
NA) values